The name El Niño refers to warmer than normal sea temperatures in the central and eastern tropical Pacific ocean west of Peru and Ecuador. It is part of a cycle of changing ocean temperatures known as the El Niño Southern Oscillation, abbreviated ENSO. The cold period of this cycle is know as La Niña. The length of the warm El Niño phase and the cold La Niña may last from 8 months to 2 years. These ENSO has been shown to affect the weather in different parts of the world. But is there any effect in New England? The graphs below help to answer this question.
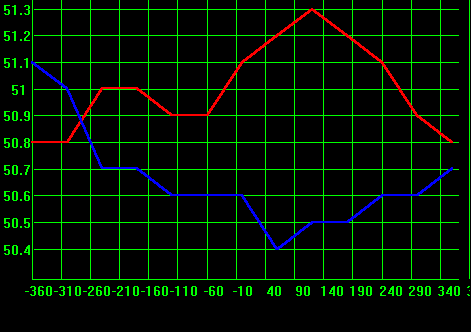
This graph below shows average annual temperature at Boston during El Niñ and La Niña cycles. El Niño related temperatures are plotted in red, La Niña temperatures in blue. The temperatures in Fahrenheit indicated on the left side of the graph. The bottom of the graph shows the number of days from the beginning of the start of an El Niño or La Niña cycle. Negative numbers indicate days before the start of the cycle.
The interpretation is that the Boston temperature over a year averages several tenths of a degree warmer following the start of an El Niño compared the start of a La Niña cycle. The warmest temperatures averaged over a year, start 120 days (or about 4 months) after the start of the El Niño cycle. The coldest is the year following 60 days after the start of a La Niña cycle.
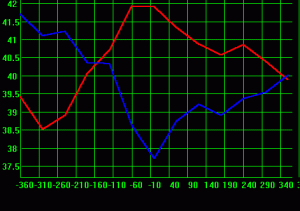
Average precipitation at Boston for one year is plotted on the graph below. Precipitation related to the start of El Niño is shown in red, La Niña in blue. Precipitation amounts in inches are shown along the left side of the graph. Numbers at the bottom of the graph are the number of days from the beginning of an El Niño or La Niña cycle.
The graph shows that in Boston, the year following the start of El Niño averages wetter than that following La Niña; The difference is about 8 percent at maximum.
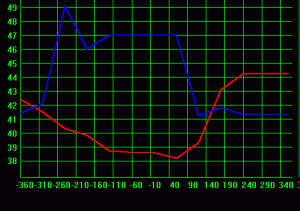
Boston snowfall averages for one year are plotted on the graph below. The numbers on the left side of the graph are the number of inches of snow that fell over a one year interval. La Niña data is plotted in blue, El Niño in red. Numbers at the bottom are the number of days from the start of the cycle that the year average begins. Negative numbers indicate days before the start of the cycle.
This shows that there is more snow associated with La Niña than El Niño at Boston. The maximum effects for a year seem to precede the start of the cycle by a few months.
Sunspot Numbers
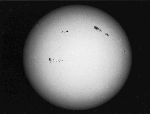
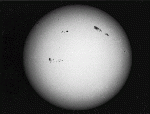
Sunspots are dark areas of irregular shape on the surface of the Sun. It has been observed that they vary in numbers in both short-term and long-term. An average sunspot cycle lasts 11.1 years. During the cycle the average sunspot count varies from around 15 at minimum to well over 100. Spots are often big enough to be seen with the naked eye. Direct observation of the Sun in a clear sky is painful and dangerous.
The following graphs were made using the 3 years for each sunspot maximum. This consists of one year either side of the year of maximum sunspots. Then averages of temperature, precipitation, and snow fall was computed for these three years and and different offsets from them. For instance for the maximum in 1989 the years 1988, 1989, and 1990 were used. Data plotted on the zero line are annual averages for this span of years for all the sunspot maximums. Data plotted on the -1 line use one year earlier for each of the years while data on the 1 line use one year later for each of the years.
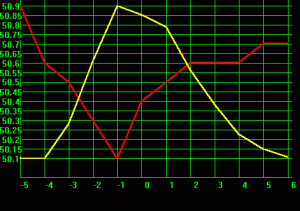
The graph below shows how temperature is related to the sunspot cycle in Boston. The average temperature for one year at Boston is plotted in red. The numbers at the left indicate the temperature in Fahrenheit. The numbers along the bottom of the graph are the number of years from the maximum in the sunspot cycle. The yellow line represents the average sunspot numbers with no coordinate reference.
There appears to be an effect during a sunspot maximum that results in a very slightly cooler yearly average temperature. The temperature then tends to rise again as the sunspot numbers decrease.
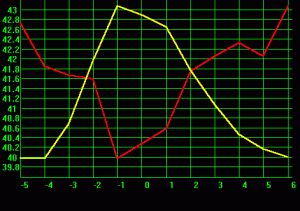
Precipitation averages during the sunspot cycle are shown below. Boston yearly precipitation is shown in red with the amount in inches on the left of the graph. The number of years offset from the sunspot maximum is indicated along the bottom of the graph. The yellow line represents the sunspot count number but has no coordinate reference.
Boston annual precipitation decreases slightly when sunspot numbers are high. The difference in average annual precipitation between sunspot maximum and sunspot minimum is about 3 inches.
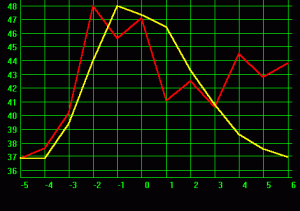
This graph shows annual snowfall averages at Boston during the sunspot cycle. The numbers on the left side of the graph are snow fall amounts in inches. Numbers along the bottom are the number of years offset from sunspot maximum. The yellow line is an indication of sunspot numbers during one cycle. There are is reference to actual numbers for this on the graph.
The graph clearly shows that the average annual snowfall at Boston rises as sunspot numbers increase. Snowfall is less again as the sunspot minimum approaches.
Warming
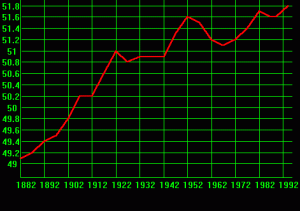
Much is said about global warming. You can not draw any conclusions about this using a single location. But, has the temperature in Boston been changing over the years? To examine this average temperatures were computed for 20 year periods every 5 years. The last ten years used only a 10 year average. These are plotted on the graph below centered over the year in the middle of the period.
The trend in average temperature at Boston is clearly up. This is probably partly due to the heat island effect due to energy sources and less vegetation surrounding the city.
These graphs were created using 207 years of climatological data at Boston, dates of El Nino La Nina cycles as derived by the Japan Meteorological Agency, and annual sunspot count averages. El Nino cycles were from estimated from ocean temperature measurements before satellite data was available. Cycles begin on October 1st and end September 30th. Data used in the graphs was from the period 1872 to 1998.
Bet on the Boston Celtics at MyBookie.ag and when you redeem the MyBookie promo code at https://bettingsitesusa.net/mybookie-promo-code/, you can get up to a $1500 bonus!
Check out a Boston Celtics home game at TD Garden.
More From SolarStorms.org:
Submit your review | |

